


Introduction
This post aims to shed light on database performance within Azure, focusing on a direct comparison between MySQL, MariaDB, and PostgreSQL. Despite abundant literature on the subject, practical tests that measure real-life performance are scarce.
Many discussions revolve around the differences between these databases rather than their actual performance. When I started this research, my priority wasn't the differences but finding a performant database that could serve as a viable Azure-based alternative for our MariaDB Monolithic setup. Initially, we thought switching from MariaDB to MySQL was a straightforward replacement with almost no performance impact. We were wrong there!
"There are many opinions about performance, But we needed facts"
We encountered a massive regression in performance in every query. Performance is crucial to us, and it was perplexing to see MySQL lag behind MariaDB so much. Upon discovering this, we set up a MariaDB VM ourselves in Azure, which proved to be performant again but introduced a lot of additional maintenance and management challenges, such as ensuring uptime, hot standby, and backups.
This led me to explore PostgreSQL, hoping for better performance than what MySQL offered. With this introduction, let's dive into the tests we conducted, including a complex query and a set of small queries, to test the performance differences between the three databases and their implementations within Azure. We also included Docker tests to be able to determine whether the performance discrepancies are database-related or if Azure is the contributing factor.
Testing our complex Query
To assess the databases, we ran a complex query that aggregated data from multiple tables, representing a realistic workload for our system. For confidentiality reasons, we've altered table and column names in this description. This query aimed to evaluate how each database handles data aggregation and complex joins.
WITH AggregatedSkateData AS (
SELECT
    e.id AS eventID,
    e.theme_cid AS themeCID,
    s.id AS skateID,
    p.firstName || ' ' || p.lastName AS participantName,
    l.label AS locationLabel,
    s.priceOffered,
    s.inspectionCompleted,
    s.registrationDate,
    s.eventStartDate,
    org.name AS organizerName,
    'https://skateeventimages.net/' || im.path AS organizerImageURL,
    s.registrationCode,
    COUNT(DISTINCT CASE WHEN pa_last.status_cid = 0 OR pa_last.id IS NULL THEN sp.id END) AS partsPending,
    COUNT(DISTINCT CASE WHEN pa_last.status_cid = 1 THEN sp.id END) AS partsRequested,
    COUNT(DISTINCT CASE WHEN pa_last.status_cid = 2 THEN sp.id END) AS partsConfirmed,
    COUNT(DISTINCT CASE WHEN pa_last.status_cid = 8 THEN sp.id END) AS partsDenied,
    MAX(CASE WHEN ti_unscanned.id IS NOT NULL THEN 1 ELSE 0 END) AS hasUnscannedTickets,
    s.isPublic
FROM
    skateEvents s
    INNER JOIN events e ON s.eventID = e.id
    INNER JOIN participants p ON p.id = e.participantID
    LEFT JOIN organizers org ON org.id = e.organizerID
    LEFT JOIN images im ON im.id = org.profileImageID
    LEFT JOIN locations l ON l.id = s.locationID
    LEFT JOIN skateParts sp ON sp.eventID = s.id
    LEFT JOIN partApprovals pa ON pa.id = sp.partApprovalID
    LEFT JOIN ticketsUnscanned ti_unscanned ON ti_unscanned.id = sp.ticketID AND ti_unscanned.scannedAt IS NULL
    LEFT JOIN partApprovalActions pa_last ON pa_last.id = (
        SELECT pa2.id
        FROM partApprovalActions pa2
        WHERE pa2.partID = pa.id
        ORDER BY pa2.id DESC
        LIMIT 1
    )
WHERE
    s.registrationDate IS NOT NULL
    AND e.cancelledAt IS NULL
    AND e.deletedAt IS NULL
    AND s.isArchived = false
    AND s.deletedAt IS NULL
GROUP BY
    e.id, e.theme_cid, s.id, p.id, p.firstName, p.lastName, org.id, im.id, l.id, l.label, s.priceOffered, s.inspectionCompleted, s.registrationDate, s.eventStartDate, org.name, im.path, s.registrationCode, s.isPublic
)
SELECT * FROM AggregatedSkateData
WHERE
    TO_CHAR(s.registrationDate, 'YYYY-MM') = '2024-03'
    OR partsDenied + partsRequested + partsPending > 0
ORDER BY s.registrationDate DESC
Azure, complicated query
We conducted these tests within the same Azure zone for containers and databases to avoid interzone latency. Below are the specifications and results for transparency. It's worth noting that for MariaDB and MySQL, the performance specifications didn't markedly affect outcomes, provided we avoided the first (burstable) tier. PostgreSQL was the exception, showing noticeable improvements in large query runtimes.
Using HeidiSQL via the Azure VPN, we determined our best results out of five runs.
MySQL Flexible, Zone 2 (Standard_E4ds_v5, 450 iops)
Found rows: 130
Duration for 1 query: 13,875 sec
MariaDB VM, Zone 2 (Standard B4s v2 (4 vcpus, 16 GiB memory))
Found rows: 130
Duration for 1 query: 10,625 sec
23.4% better then MySQL
Postgres Flexible, Zone 3 (Standard_E4ds_v50 p10, 500 iops)
Found rows: 130
Duration for 1 query: 3,953 sec
71.5% better then MySQL
Local Docker, complicated query
Local hardware we tested on
12th Gen Intel(R) Core(TM) i9-12900H, 2900 Mhz, 14 Core(s), 20 Logical Processor(s)
Installed Physical Memory (RAM) 32,0 GB
MySQL 8.3 Docker
Found rows: 130
Duration for 1 query: 12,437 sec
MariaDB 11.4 Docker
Found rows: 130
Duration for 1 query: 9,484 sec
Postgres 16.2 Docker
Found rows: 130
Duration for 1 query: 3,969 sec
This concludes our complicated query tests. It is awesome to see Postgres perform so well here! We used to run in MariaDB before we started our move to Azure. It was very sad to see such bad performance in MySQL the moment we started testing with this new setup.
Testing our set small Query's
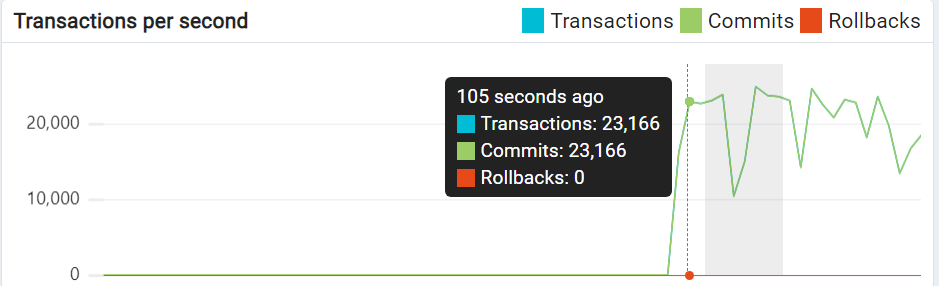
The next test is when we fire more then 20.000 transactions per second against each database which will build us a feed in JSON that takes a certain amount of time to complete. we stress our database better with a lot of query's which will give us a average runtime for every database.
There is also some PHP logic here since this is a PHP script we run to generate the feed. But it runs on the same hardware/docker image all the time. so the difference in runtime comes from the database.
For this we moved our containers to the same zone as our database is running to also take away potential issues with zone latency.
We are running this script within our Laravel framework. We are running our PHP against Swoole for the best possible performance within PHP 8.
Azure, small query's
In this test we also introduce container performance aspects .
We run our containers and database again in the same Zone in Azure (Western Europe). When using Azure we run with a lot less performance than we have available in our docker environment.
For this we can only use these results to compare the differences within docker and Azure itself, not between them. Comparing the two together wont mean anything due to this hardware difference. We only want to observe the difference in runtime against the databases. and Docker is a baseline to check if the differences match up with the differences we see in Azure.
Our Node Size in Azure is a standard_b2s, 2 vCPUs with 4 GiB of RAM
API, Zone 2 -> MariaDB VM, Zone 2
24.59s runtime (spot nodes)
API, Zone 2 -> MySQL Flexible, Zone 2
27.87s runtime (spot nodes)
API, Zone 3 -> Postgres Flexible, Zone 3
24.92s runtime (spot nodes)
Local Docker, small query's
For the small query tests within local Docker we utilize a system powered by a 12th Gen Intel(R) Core(TM) i9-12900H CPU, running at 2900 MHz with 14 cores and 20 logical processors, complemented by 32 GB of installed RAM.
These Docker images are configured to be memory-bound, meaning their performance was primarily dependent on the available memory rather than being limited by the CPU. The CPU settings were configured to allow unrestricted performance, ensuring that Docker can utilize as much CPU resource as needed.
Before each test run against a Database, I made sure to restart the Docker container to refresh its connection. After restarting, I allowed a 30-second pause to ensure that the container had fully stabilized and was running idle. This pause is crucial for ensuring more consistent test conditions. Once the container was ready, I initiated the feed generator script to begin building the feed, assessing how effectively our different database setups could handle small queries under these controlled conditions.
API -> MariaDB 11.4 Docker
22.88s runtime
API -> MySQL 8.3 Docker
23.74s runtime
API -> Postgres 16.2 Docker
20.77s runtime
MariaDB query cache
In our past use of MariaDB within our monolithic setup, we made significant use of the query cache functionality. This feature played a crucial role in delivering performance for repeated queries. This efficiency persists until the cache requires rebuilding, typically triggered by updates or inserts into the cached query's tables. Lets do a second run on our complex query with Query cache enabled.
Local MariaDB Docker
Found rows: 130
Duration for 1 query: 0,000 sec
However, the performance benefits of the query cache aren't universally consistent. For instance, when executing an average of 20,000 transactions per second with small queries, the runtime dropped to some extent. This variance highlights that the query cache doesn't always produce the same level of optimization, particularly under high-load conditions. but more about that topic later.
API -> Local MariaDB Docker (query cache enabled)
17.30s runtime
API, Zone 2 -> MariaDB VM, Zone 2 (query cache enabled)
22.72s runtime (spot nodes)
The query cache in MariaDB works by storing the result set of SELECT queries, along with the query text. When an identical query is executed again (with the same text and under the same database user privileges), MariaDB can bypass the query execution phase, pulling the result directly from the cache. This feature can drastically reduce query execution times for frequently run queries that do not alter data.
It's important to approach the use of MariaDB's query cache with caution. Despite its benefits, the query cache was deprecated and disabled by default in newer versions of MariaDB 10.1.7 (and MySQL as of version 5.7.20) due to concerns over its impact on performance in environments with high levels of concurrent transactions. Nonetheless, for specific scenarios, particularly those with a predominant read workload, the query cache can still significantly enhance performance. It is completely removed in MySQL 8 and up.
Observation on Azure's Flexible Servers
These tests highlight that the performance of databases on Azure's flexible servers has improved significantly, aligning closely with the performance seen in local Docker environments. This marks a decent improvement from the previous Azure database single servers, which typically exhibited lesser performance due to some form of overhead introduced by how it was it was running in the Azure cloud.
Azure Latency anomaly
As an added bonus, we conducted some additional tests to measure interzone latency when connecting from Zone 1 or 2 to a PostgreSQL database in Zone 3 within Azure.
API, Zone 2 -> Azure PostgreSQL Flexible, Zone 3
The runtime was 44.23 seconds.
Interestingly, the runtime doubled again, a phenomenon observed exclusively when communications occur between Zones 1-2 and Zone 3, or vice versa. This pattern suggests that any container requiring a database connection experiences significant latency under these conditions, whereas latency is nearly negligible when the interaction is between Zone 1 and Zone 2.
For those who might have missed it, I've previously discussed a latency anomaly encountered in Zone 3. The conventional wisdom suggests maintaining the database connection within the same zone to minimize latency. However, our tests show that the latency impact is minimal when operating between Zones 1 and 2, but it becomes significantly pronounced when crossing from Zones 1 or 2 to Zone 3.
This testing further confirms that the latency issue is not exclusive to MySQL Flexible services but also affects PostgreSQL Flexible services within Azure at least, indicating a broader pattern across Azure's database offerings.
 Remco Loup.
Conclusion
From a performance related evaluation, it's clear that choosing the right database is crucial and should match your app's specific needs for speed and efficiency. The results show MySQL tends to be slower. MariaDB works well and has a handy query cache feature, but Azure has no support for MariaDB anymore. This makes PostgreSQL the most viable choice for performance-focused users in Azure, as it excels in handling both complex and numerous simple queries effectively as shown in the tests above.
This analysis hopefully helps in selecting the right database technology and underlines how important careful planning is for boosting your app performance. For those using Azure and looking for top tier performance, PostgreSQL is the go-to option in my test results.
There are other reasons to choose your database on. But i only wanted to focus on the performance aspect in this post. This was our main concern since we are in the proces of moving from a Monolithic server to Azure. There are more things to consider when switching databases. The advantage here is that all three databases can be integrated quite easily if you use either of them.
Postgres is the best compatible here with its strict routines. The complicated query above is written for Postgres and runs in MariaDB without a single change. For MySQL the TO_CHAR in the last line only needs to be replaced with DATE_FORMAT.


